This website uses cookies so that we can provide you with the best user experience possible. Cookie information is stored in your browser and performs functions such as recognising you when you return to our website and helping our team to understand which sections of the website you find most interesting and useful.

- Home
- About
- Services
- AI & ML
- AI and ML Strategy Consulting
- Custom AI and ML Solutions
- Data Science and Analytics
- Natural Language Processing (NLP)
- Computer Vision
- Robotic Process Automation (RPA) in AIML
- AI-Powered Business Intelligence
- AI Infrastructure and Deployment
- Model Training and Evaluation
- AI Integration Services
- Training and Workshops
- AI and ML Maintenance and Support
- AI and ML Research and Development
- Digital Transformation
- Digital Strategy and Consulting
- Cloud Solutions
- Data Analytics and Business Intelligence
- Artificial Intelligence and Machine Learning
- Internet of Things (IoT)
- Robotic Process Automation (RPA)
- Cybersecurity
- Digital Experience and Design
- Enterprise Resource Planning Solutions
- Digital Marketing and SEO
- Business Process Automation
- DevOps Services
- Customer Relationship Management (CRM) Solutions
- Supply Chain Management (SCM) Solutions
- Data Science and Big Data Analytics
- Digital Transformation Training and Workshops
- Cloud Computing Solutions
- Digital Product Development
- IT Infrastructure Services
- Careers
- POC/Demo
- Blogs
- Contact
POWER BI
Explore our successful collaborations and case studies to see how we've empowered businesses through AI and ML solutions.
Power BI Dashboards
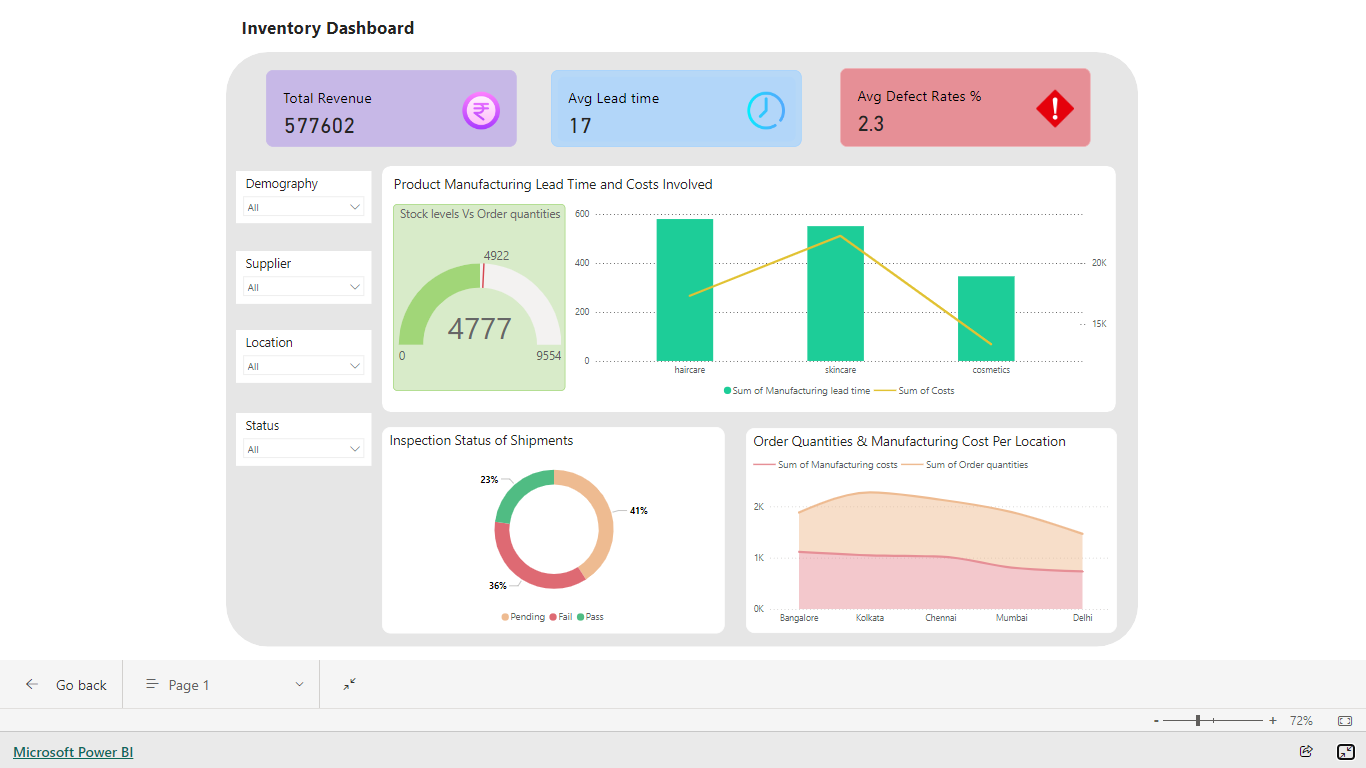
Power BI Dashboard For Inventory
Overview: The Inventory Report offers valuable insights into various aspects of inventory management, highlighting key performance indicators and supply-demand dynamics. It provides stakeholders with critical data to optimize inventory operations and meet customer needs effectively.
Key features:
Key Performance Indicator (KPI): Tracks essential metrics to assess inventory management processes’ overall performance and efficiency.
Supply and Demand: Analyzes the balance between supply and demand to ensure adequate inventory levels and minimize stockouts or excess inventory.
Supply by Product: This breaks down the supply of inventory by product, enabling stakeholders to manage procurement and production effectively.
Demand by Product: Analyzes product demand patterns to forecast future sales and adjust inventory levels accordingly.
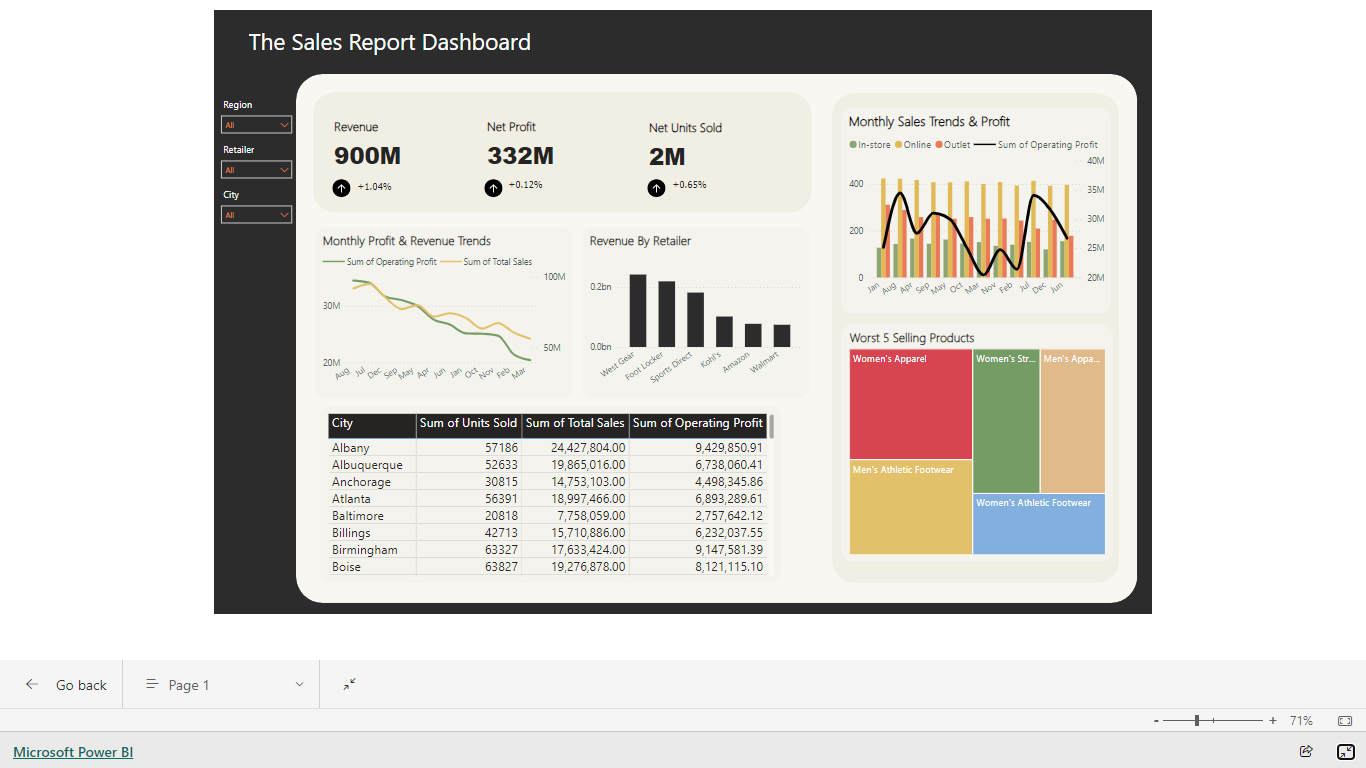
Power BI Dashboard For Sales
Overview: A sales dashboard in Power BI is a visual representation of sales data that allows you to analyze and monitor sales performance. It typically displays key sales metrics, such as revenue, profit, number of units sold, average order value, and more, in an easy-to-read format.
Key features:
Revenue by product: A visualization that shows revenue broken down by product or product category.
Sales by region: A map or chart that shows sales data by geographic region, such as country, state, or city.
Sales by time period: A chart that displays sales data over time, such as by month, quarter, or year.
Sales pipeline: A visualization that displays the status of open deals and potential revenue in the sales pipeline.
Profit margin: A visualization that shows profit margin by product or region.
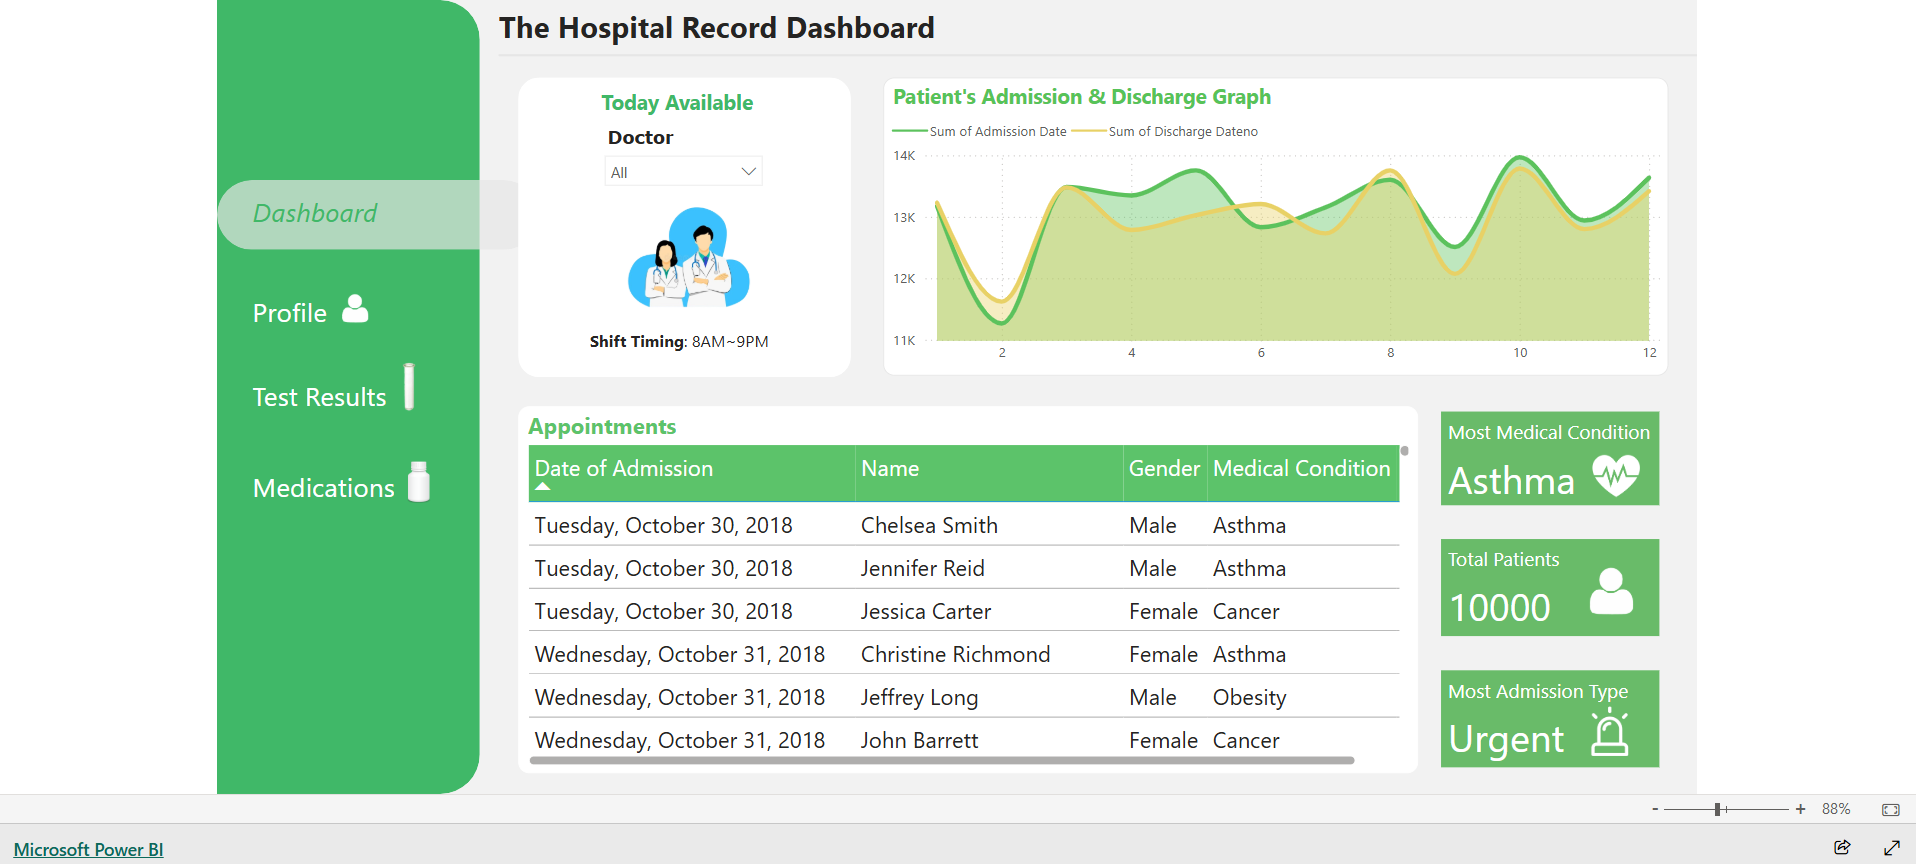
Power Bi Dashboard For Healthcare
Overview: This interactive Power BI dashboard provides a dynamic view of patient admissions and discharges within a hospital setting. It enables users to filter data by doctor and gain insights into patient demographics, medical conditions, and key performance indicators.
Key features:
Doctor Filter: A filter allows users to select a specific doctor to analyze their patient data in detail.
Patient Admissions & Discharges: A line chart visualizes the trends in patient admissions and discharges over time, facilitating the identification of peak periods and potential capacity issues.
Patient Details Table: A table displays detailed information about individual patients, including:
- Date of Admission
- Patient Name
- Gender
- Medical Condition
- Age
Key Performance Indicators (KPIs):
- Most Common Medical Condition: A card displays the most frequent medical condition among patients, currently identified as Asthma.
- Total Number of Patients: A card shows the overall count of patients within the selected filter criteria.
- Most Common Admission Type: A card highlights the most frequent type of patient admission (e.g., Emergency, Scheduled).
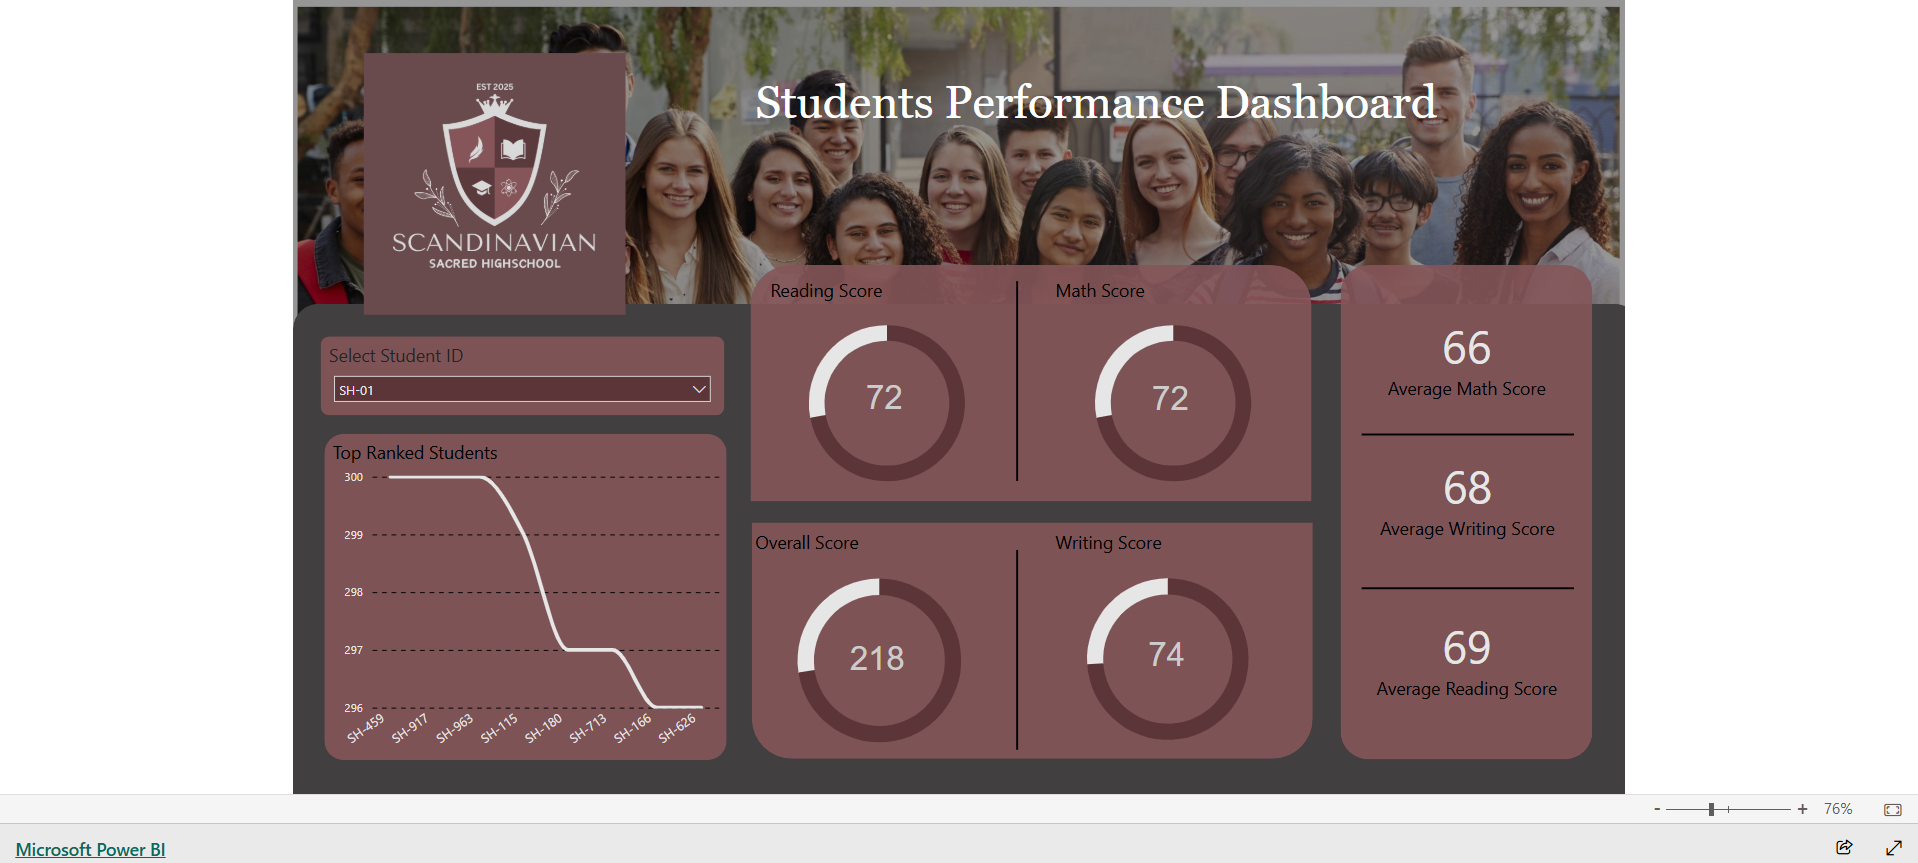
Power BI Dashboard For School & Education Institute
Overview: This interactive Power BI dashboard provides a comprehensive view of student academic performance. It allows educators to analyze individual student progress and identify areas for improvement.
Key features:
Student ID Filter: A filter enables users to select a specific student ID to view their individual performance data.
SKey Performance Indicators (KPIs):
- Average Math Score: Displays the average math score across all students.
- Average Writing Score: Displays the average writing score across all students.
- Average Reading Score: Displays the average reading score across all students.
Student Performance Pie Chart: When a student ID is selected, a pie chart dynamically displays the breakdown of the student's scores across:
- Reading Score
- Math Score
- Writing Score
- Overall Score
Sales pipeline: A visualization that displays the status of open deals and potential revenue in the sales pipeline.
Student Ranking Line Chart: A line chart visualizes the ranking of the top 10 students based on their overall scores, providing a comparative view of student performance within the top tier.

CONTACT US
Get in Touch With Us!

Empower organizations of all sizes to harness the power of Artificial Intelligence and Machine Learning, transforming their operations, decision-making, and ultimately, their success.
Contact Info
Call us now:
+91 9766331360
WebMobi 360 | AI and ML Services © 2025. All Rights Reserved


